Saturday, December 3, 2022

US Census Report on Young Adults' Homeownership, 2000-2019

The US Census Bureau issued a report roughly two weeks ago on trends in 25-34 year-olds' homeownership between 2000-2019 (link). The report notes that, "The impact on the housing market of the COVID-19 pandemic, which began in 2020, is not captured in this dataset." Even before COVID, however, the trend was not favorable and it is hard to imagine how young adults' rate of homeownership could have gotten better during the pandemic.*

The data we do have show that young adults' homeownership rose slightly and then stabilized between 2000 and 2007. The Great Recession (a large element of which involved reckless and even fraudulent conduct connected to home loans) then clobbered young-adult homeowners (existing and prospective). The percentage of young-adult heads of household who owned their homes (as opposed to renting), which had been in the mid-40 percent range as of 2007, declined to the mid-30 percent range as of 2015. As of 2019, this rate had inched up only to the high 30s. Naturally, as homeownership began to decline, renting began to rise. Here's a screenshot from the report...

The report next discussed young adults' homeownership in relation to education (Figure 2, not reproduced here). Interestingly, in the very early 2000s, young adults whose highest educational attainment was a bachelor's degree (or higher), some college, and a high school diploma all owned homes at similar rates (mid-high 40s), with those having less than a high school diploma lagging. By 2019, however, appreciable gaps in homeownership had opened up between educational categories (bachelor's-plus clearly exceeding some college, some college clearly exceeding high school graduates, etc.).

Lastly, the Census report discussed racial-ethnic differences in homeownership. Looking only at 25-34 year-olds with a bachelor's degree or higher (to hold education constant, permitting a more direct focus on race-ethnicity), we see that racial disparities still exist. As of 2019, approximately 50% of young adults who were White (either Whites overall or more specifically non-Hispanic Whites) owned their own home. Hispanic/Latinx, Asian, and other-race young adults were in the mid 30s, whereas African Americans were in the mid 20s. Remember, the educational status of all these groups was held constant.

I suspect that these disparities represent some combination of racial-ethnic discrimination (in hiring, so that minorities make less income, and in lending) and White parents having more money, on average, to help their grown children out with a down payment.

One issue I would like to see addressed within the US context is where young adults are living or trying to live. Large cities such as New York, Boston, Washington DC, Chicago, Los Angeles, and San Francisco, along with "hot" up-and-coming markets such as Austin and Nashville, have become expensive for everyone, but especially young adults. Other places such as Lubbock, Texas, and West Lafayette, Indiana, are not as expensive. Will young adults continue to gravitate to large cities -- where multiple roommates are often required even to live in an apartment -- or might there be an increase in young adults seeking out smaller towns?**

---

*In fact, there has been a lower rate of independent living for young adults during COVID. According to a report from the Pew Research Center, a few months into the pandemic (July 2020), the "share of 18- to 29-year-olds living with their parents [had] become a majority..., surpassing the previous peak during the Great Depression era." Others have pointed out that the percentage of grown children living with their parents returned to more typical levels as COVID restrictions eased. However, the financial, educational, housing, and other forms of disruption during COVID would not seem conducive to young-adult homeownership in the near future. 

**As an aside, one of my favorite neighborhoods in the whole country is Wrigleyville, by the Chicago Cubs' baseball stadium Wrigley Field. I wrote a chapter about the neighborhood in the Society for American Baseball Research book Wrigley Field: The Friendly Confines at Clark and Addison (G. H. Wolf, editor). In it, I noted that despite "Wrigleyville housing [costing] 2.2 times as much as the Chicago average," 20-29 year-olds comprise 31.5% of residents within the ZIP code containing Wrigley Field (the third-highest percentage of young adults within any Chicago ZIP code). 

Tuesday, September 6, 2022

New Historical Marriage Figures from US Census Bureau

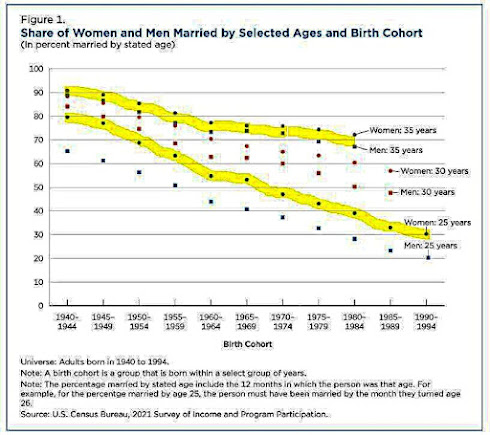
The US Census Bureau released a report a few days ago, providing extensive marriage statistics on individuals born from 1940-1994 (link). Someone born in 1940 would be 82 today, whereas someone born in 1994 would be 28. The data are grouped into five-year birth bunches (1940-1944, 1945-1949, etc.). 

As shown in the following screen capture (on which I've literally connected the dots in yellow highlighter for ease of viewing), the percentage of people married by age 25 has plummeted during the years studied. As highlighted in the lower yellow line, 80% of women born between 1940-1944 were married by age 25. By the time we get to the 1990-1994 birth-cohort, however, only 30% were married by 25. That's a huge change! Men's trend for marrying by 25 (bottom set of dots) parallels women's, although is lower in absolute level. Roughly 65% of men born from 1940-1944 married by age 25, a figure that has dropped to 20% in men born from 1990-1994. 

Note that the trendlines for men and women being marrying by age 35 (top yellow line) also declined from 1940-1944 onward, but much more gradually than did the marriage-by-25 trendlines.* What this is saying is that, even for the younger cohorts, marriage by 35 is quite common (around 70%).

The report also contains statistics on the rate of being married once vs. multiple times. Click on the above-linked article if you're interested.

---

*You may have noticed that there are no married-by-35 data-points for the two youngest birth-cohorts (1985-1989 and 1990-1994). The reason is that nobody born from 1990-1994 has yet reached age 35, whereas only some in the 1985-1989 cohort have. Hence, the percent in these cohorts who have married by age 35 won't be known for a few more years.

Thursday, August 25, 2022

New National Findings on US 19-30 Year-Olds' Substance Use

Earlier this week, results came out from one of the major US substance-use surveys, namely the annual Monitoring the Future project conducted by the University of Michigan. The headline of UM's news release was "Marijuana, hallucinogen use at all-time high* among young adults." However, I think some of the alcohol-related findings are also quite interesting. 

Regarding past-year marijuana use (i.e., any use of marijuana in the past year), 30.8% of 19-30 year-olds in the year 1988 had smoked some pot in the past 12 months. This figure dipped into the low-20% range during much of the 1990s, rose slightly into the mid-high 20% range in the 2000s, rose through the 30% range in the 2010s, and reached 42.6% as of 2021 (see Figure 1 of full report).    

Past-year hallucinogen use had a roughly 3%-4% prevalence among 19-30 year-olds consistently from 1988-2017 (Figure 20 of full report). The figure rose to around 5% in 2018 and 2019, before escalating to 7.6% in 2020 and 8.1% in '21. Some of the survey's methodology was changed during COVID-19. One can also envision how stay-at-home orders -- and the potential accompanying boredom -- might have affected substance use. However, any direct linkage between COVID-related factors and recent substance-use increases does not appear to have been established at this time.

One set of analyses compares current full-time college students to same-age noncollege peers (i.e., within four years post-high school) in their substance-use patterns. Results are also broken down by gender, yielding four groups: male college students, male noncollege individuals, female college students, and female noncollege individuals. As shown in the full report, past-year alcohol consumption was most common among college women (77.5% engaging in the behavior), followed by college men (73.4%), noncollege women (71.9%), and noncollege men (65.3%) (see Table 27). 

On a measure of heavier alcohol consumption -- number of occasions within the previous two weeks consuming five or more drinks -- the group with the highest rate was college men (33.9%), followed by college women (28.8%), noncollege women (24.7%), and noncollege men (23.3%) (Table 29). Hence, college continues to be a social context conducive to heavy drinking and differences between young men and women continue to shrink.

---

*Whether the pun of juxtaposing "marijuana" and "high" was intentional or unintentional, I don't know.

Friday, July 29, 2022

My New Textbook on Emerging Adulthood

My new textbook Journeys through Emerging Adulthood has now been published. A free preview of Chapter 1 is available via Amazon and the book's publisher, Routledge/Taylor & Francis. The book is the culmination of my 20+ years of doing research on emerging adulthood and 14 years of teaching the course Development in Young Adulthood at Texas Tech University. It was a labor of love to write.

I'm happy to discuss possible adoptions with anyone. Some university departments of human development and family sciences offer courses on young adulthood or one could offer a special-topics course in psychology or sociology. Twenty-somethings and parents of twenty-somethings may also enjoy the book. 

Wednesday, July 27, 2022

Young-Adult Voters' Attitudes Toward President Biden Roughly Three Months Before 2022 Midterm Elections

Five-Thirty-Eight has a piece today examining the low percentage (slightly below 40%) of 18-29 year-old Americans who approve of the job President Joe Biden is doing. This approval rate is not that different from that of Americans as a whole; however, considering young voters' overwhelming support of Biden in the 2020 election, their diminished approval is highly notable. The article explores many possible reasons for Biden's dip among young adults, but one in particular meshes with the study of emerging adulthood.

Extensive research on laypersons' criteria for considering someone an adult shows one of the three primary standards to be whether the person has achieved financial independence. The Five-Thirty-Eight article notes that those transitioning to adulthood indeed hold themselves to this standard ("35 percent of Americans age 15 to 25 said financial independence was their most or second-most important life aspiration, ahead of other priorities such as having a fulfilling career or being married"). The uneven economic performance under Biden -- low unemployment but high inflation -- is thus likely dragging down approval for the President.

Emerging-adulthood scholars also are interested in young adults' election turnout -- traditionally low but strong in the last midterm election year of 2018. There are, of course, questions of whether low enthusiasm for Biden will affect 18-29 year-olds' turnout to vote this upcoming November. The Five-Thirty-Eight piece quotes John Della Volpe, a pollster specializing in young voters, to the effect that "Despite the frustration that young people have about government in general, they just feel more connected to voting.” 

Personally, I'll need more evidence in the coming years to proclaim young adults "connected to voting." But if they do turn out heavily this November despite their current low enthusiasm for President Biden, it will be noteworthy.